
How does RSI work?
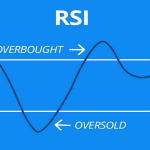
The RSI indicator used in technical analysis which defines the strength of tren and probability of trend reversal. Also, it is used to evaluate overbought or oversold conditions in the price of the stock.
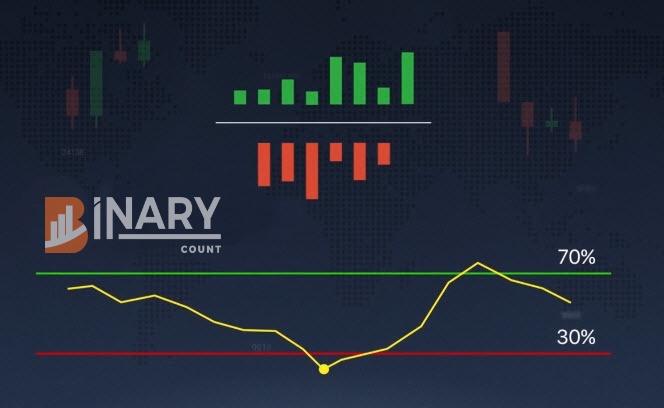
The indicator shows the data on zero per cent to hundred per cent. Thus if all the candlesticks are green it signifies hundred per cent and if at the end of the day all the candlesticks are red it signifies zero percent.
Period and overbought/oversold areas
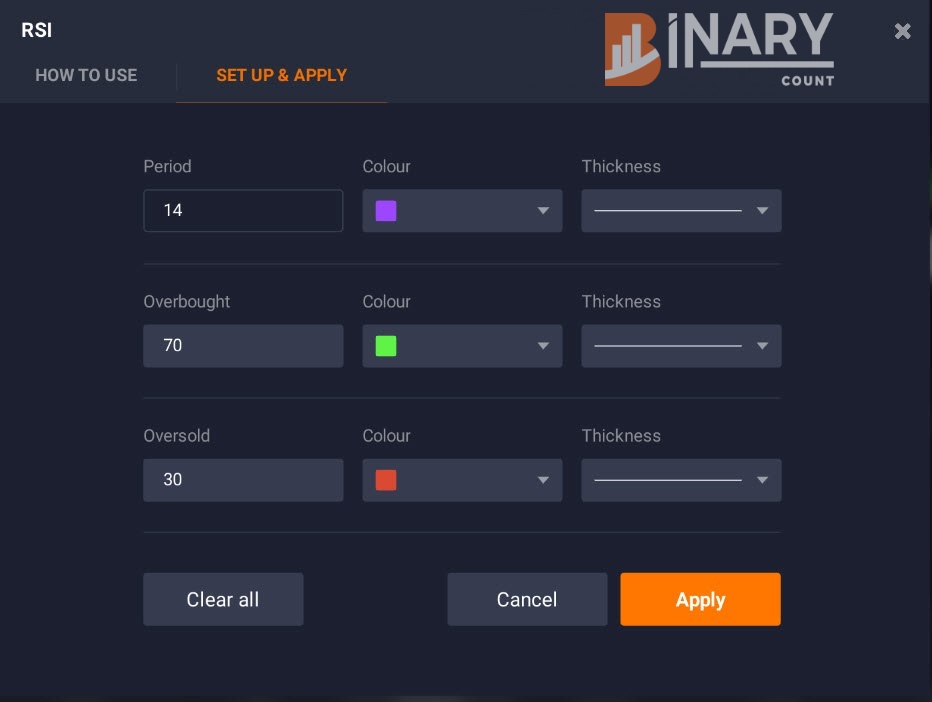
A period is nothing but a candlestick quantity which is used for data collecting. It is always set on 14 by default in the indicator settings.
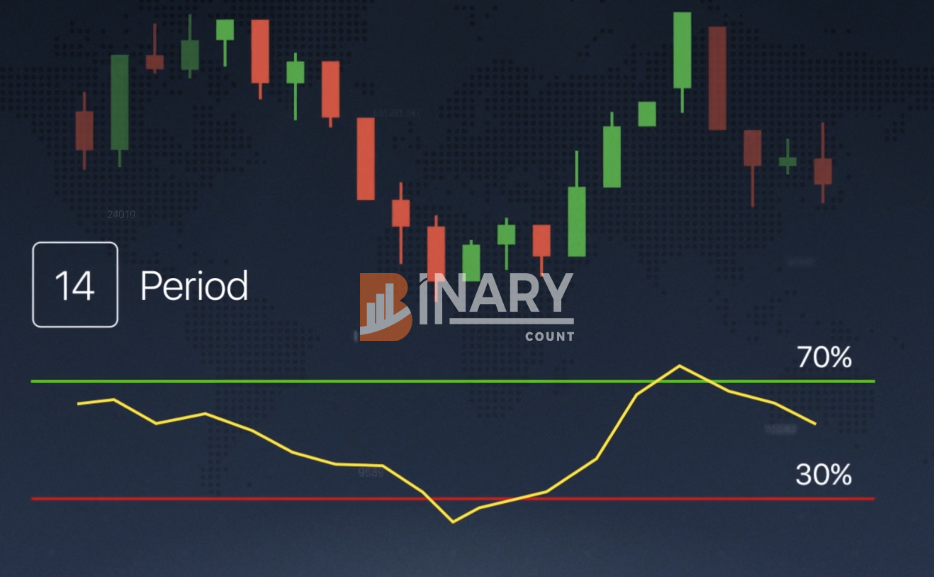
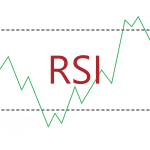
There are also overbought and oversold values which are set to 70 per cent and 30 per cent by default respectively. If overbought values get closer to 100 per cent and oversold value to 0 per cent then it is more precise signals.
Using Relative Strength Index
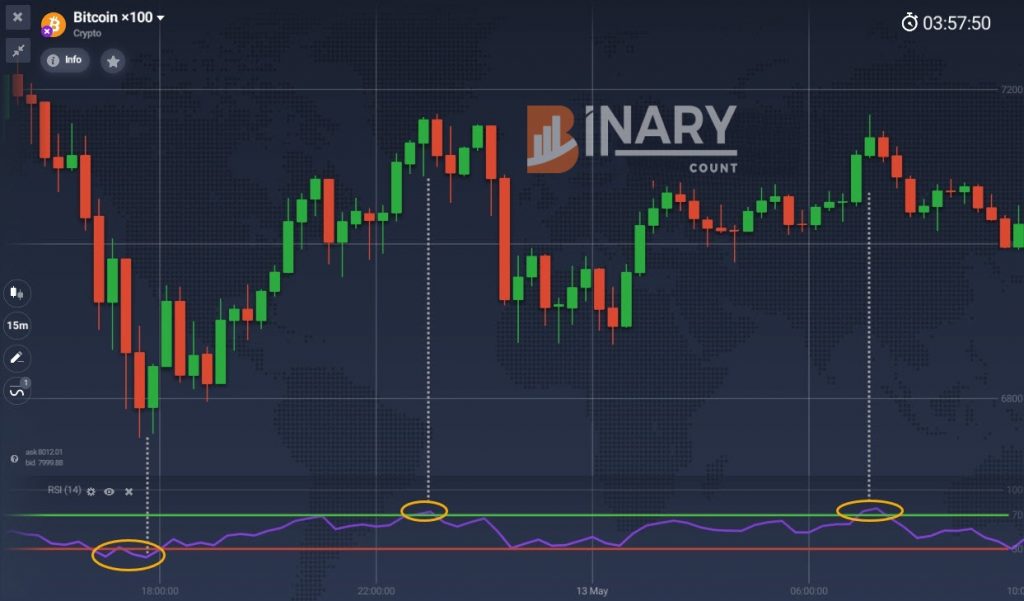
You can determine an overbought case when an RSI indicator intersects on a higher level and an oversold case occur when the indicator intersects on a lower border where prices are expected to get too low or too fast.
We urge you to read about divergences on RSI as it is an interesting way to Relative Strength Index(RSI) on the IQ Option platform.
We wish you successful trading!
You might also want to read

Top 5 Trending

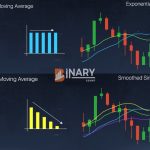
The Exponential Moving Average (EMA) is a moving average indicator. Moving Average indicators are trend-following indicators which smooth out price… [Read More]

The Three White Soldiers is a candlestick pattern that signals a strong uptrend reversal. This pattern usually forms at the… [Read More]

The main trade room window of IQ Option platform shows a chart of an asset. Main trade room window at… [Read More]

Are you an account on IQ Option? Have you forgotten your password to log into your account? Then here is… [Read More]
Thank You!
First time any content of the website helps me. Thank you.